Executive Insights
| SERIES 4.0 FEATURE |
Overview
Executive Insights provides Senior Leaders and Executives with a dashboard that centralises ControliQ metrics.
It supports them in analysing operational performance to identify events they should react to, fires that need to be put out, potential risks to mitigate, events to celebrate and opportunities to improve.
The Executive Insights dashboard is available for workgroups of department or higher.
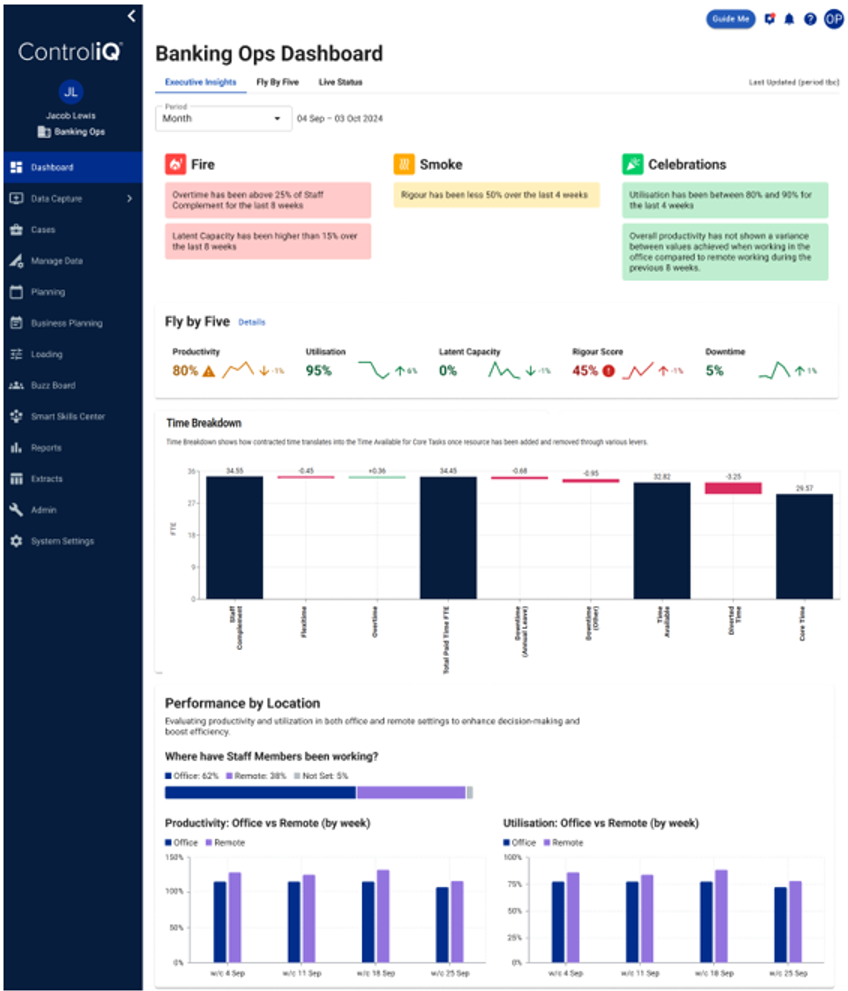
The Executive Insights dashboard displays key ControliQ metrics in individual panels
The Smoke, Fire, and Celebration panel helps senior leaders and executives monitor and respond to various operational events.
This panel highlights key metrics and categorises them into three distinct areas:

|
Fire, Represents urgent and critical issues that need immediate action. These are areas where performance is significantly off target and require prompt intervention to mitigate risks and resolve problems. |

|
Smoke, Indicates potential issues that may not yet be critical but require attention to prevent escalation. It helps leaders identify and address these early signs of trouble before they become major problems. |

|
Celebration, Highlights achievements and positive performance metrics. This allows leaders to recognise and celebrate successes, boosting morale and reinforcing positive behaviours within the teams. |
Depending on the workgroups data pre-defined rules in ControliQ will prompt different messages to appear within the panel:
|
Fire Rules |
Smoke Rules |
Celebration Rules |
|
|---|---|---|---|
|
Overtime |
Total weekly Overtime was greater than 25% of staff complement for 8 continuous weeks. |
Total weekly Overtime was above 25% of staff complement for 4 continuous weeks. |
Total Overtime as a percentage of staff complement has decreased during the previous 4 weeks. |
|
Flexitime |
Total weekly Flexitime was above 15% of staff complement for 8 continuous weeks. |
Total weekly Flexitime was above 15% of staff complement for 4 continuous weeks. |
Total Flexitime has decreased during the previous 4 weeks. |
|
Utilisation |
Total Utilisation was greater than 90% during the previous 8 weeks. Total Utilisation was less than 70% during the previous 8 weeks. |
Total Utilisation was greater than 90% during the last 4 weeks. Total Utilisation was less than 70% during the previous 4 weeks. |
Total Utilisation was between 80% and 90% during the previous 4 weeks. |
|
Productivity |
Productivity has decreased by 5% or more during the previous 8 weeks. |
Productivity has decreased by 5% or more during the previous 4 weeks. |
Productivity has increased during the previous 4 weeks. Productivity has been maintained for the previous 4 weeks. |
|
Latent Capacity |
Latent Capacity has averaged 15% or more during the previous 8 weeks. |
Latent Capacity has averaged 10% or more during the previous 4 weeks. |
Latent Capacity has averaged 5% or less during the previous 4 weeks. |
|
Rigour |
The Rigour Indicators score was less than 40% during the previous 4 weeks. |
The Rigour Indicators score was less than 50% during the previous 4 weeks. |
The Rigour Indicators score was 85% or above during the previous 4 weeks. |
|
Location Performance |
Overall productivity achieved when in the office has varied by 10% or more compared to overall productivity achieved when working remotely during the previous 8 weeks. |
Overall productivity achieved when in the office has varied by 10% or more compared to overall productivity achieved when working remotely during the previous 4 weeks. |
Overall productivity has not shown a variance between values achieved when working in the office compared to remote working during the previous 8 weeks. |
The Fly by Five panel displays the five key metrics for the previous 30 or 90 days and applies a red, amber or green status to them based on the tolerances and targets set for the workgroup in the Fly by Five dashboard.
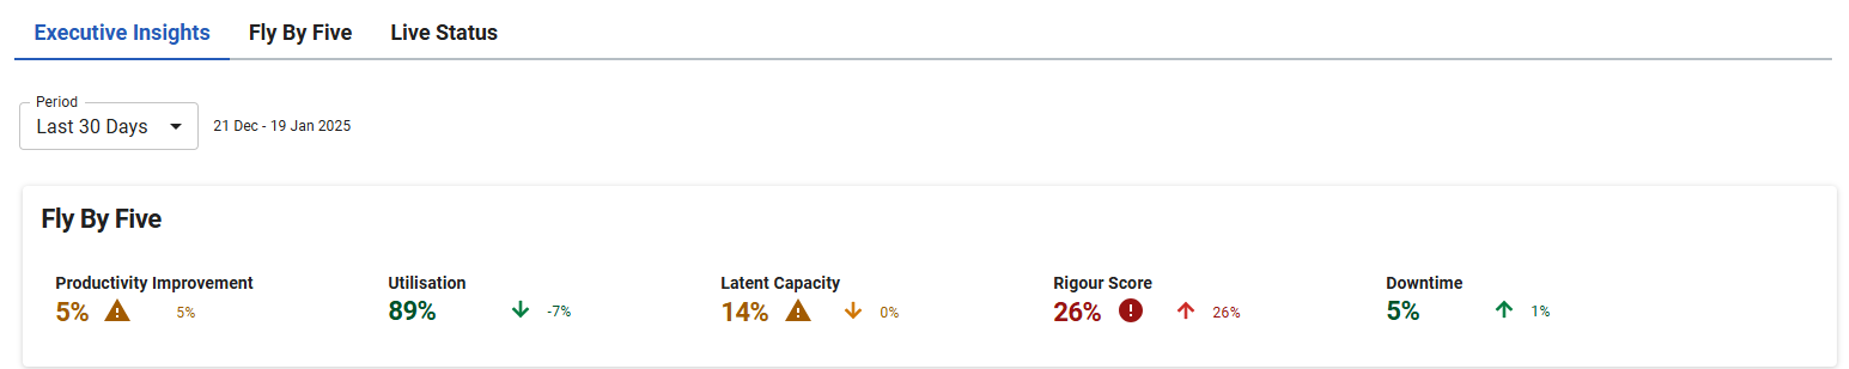
Remember the Executive Insights Dashboard is reviewing these key metrics for the previous 30 or 90 days whereas the Fly by Five Dashboard is reviewing these key metrics by week, calendar month or calendar quarter so the values shown in the 2 dashboards will differ as they are based on different date ranges.
The time breakdown panel provides a graphical view in FTE of how much working time has been available for the workgroup in the past 30 or 90 days and how this time has been utilised.
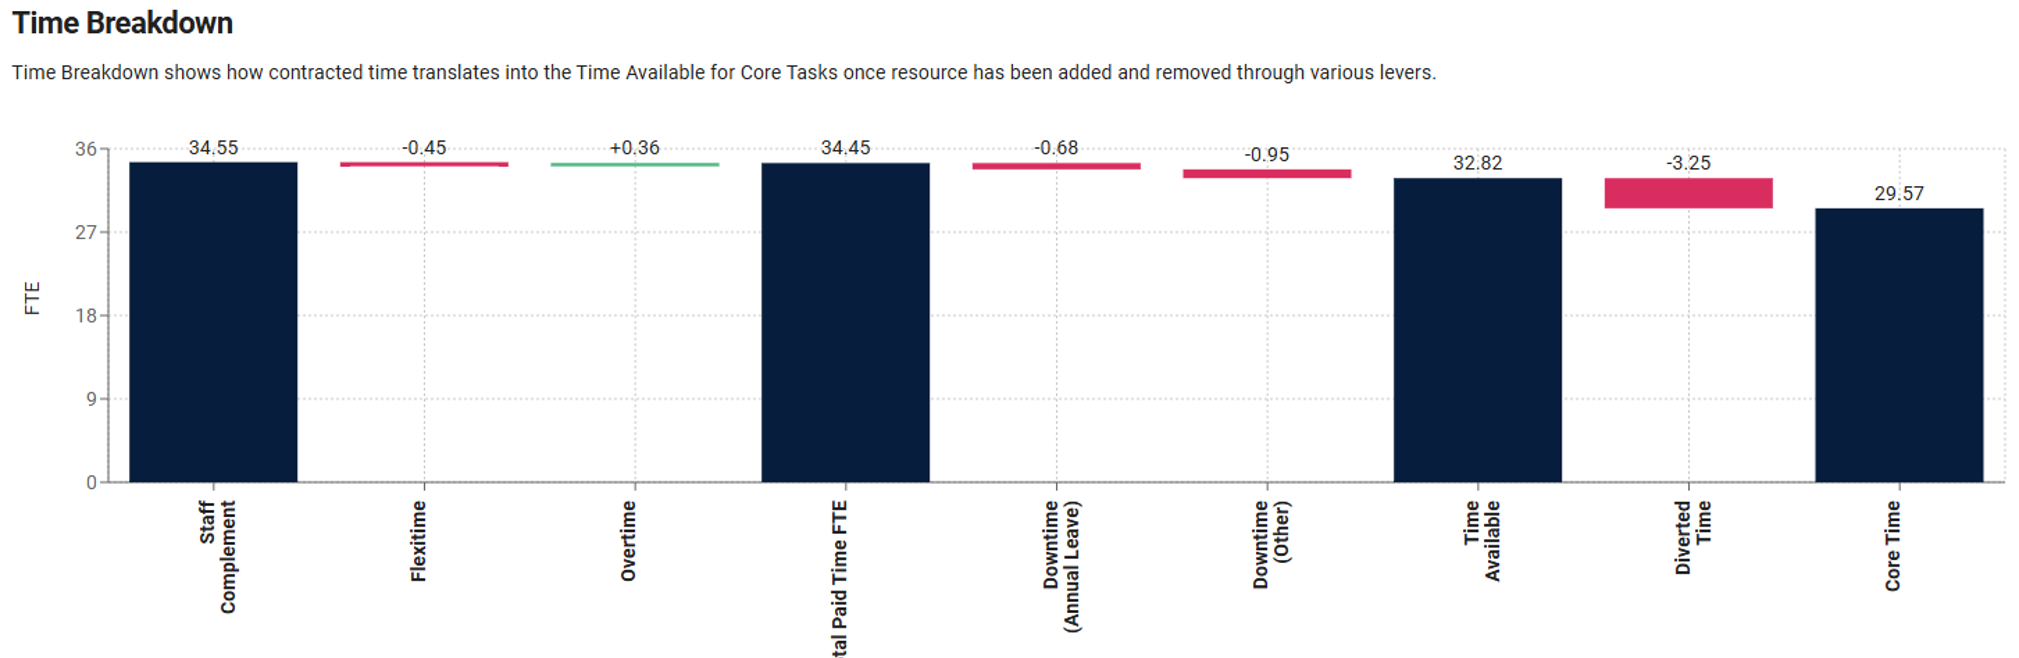
|
Category |
Description |
|---|---|
| Staff Complement |
= Staff Complement + Temporary + Variable Staff |
|
Flexitime |
= Total captured Positive Flexitime + total captured Negative Flexitime |
|
Overtime |
= Total captured Overtime |
|
Total Paid Time FTE |
= Staff Complement + Temporary + Variable + Overtime |
|
Downtime (Annual Leave) |
= Total captured Annual Leave |
|
Downtime (Other) |
= National Holiday + total captured all other Downtime categories |
|
Time Available |
= Total Staff Complement (including temporary and variable staff) + Flexitime + Overtime +/- resource Loaned and Borrowed from outside the selected workgroup – Downtime |
|
Diverted Time |
= Total captured Diverted Time |
|
Core Time |
= Total Time Available – Total Diverted Time |
The Capacity Opportunity panel highlights the FTE you are currently losing due to over target Latent Capacity and below target Utilisation scores.
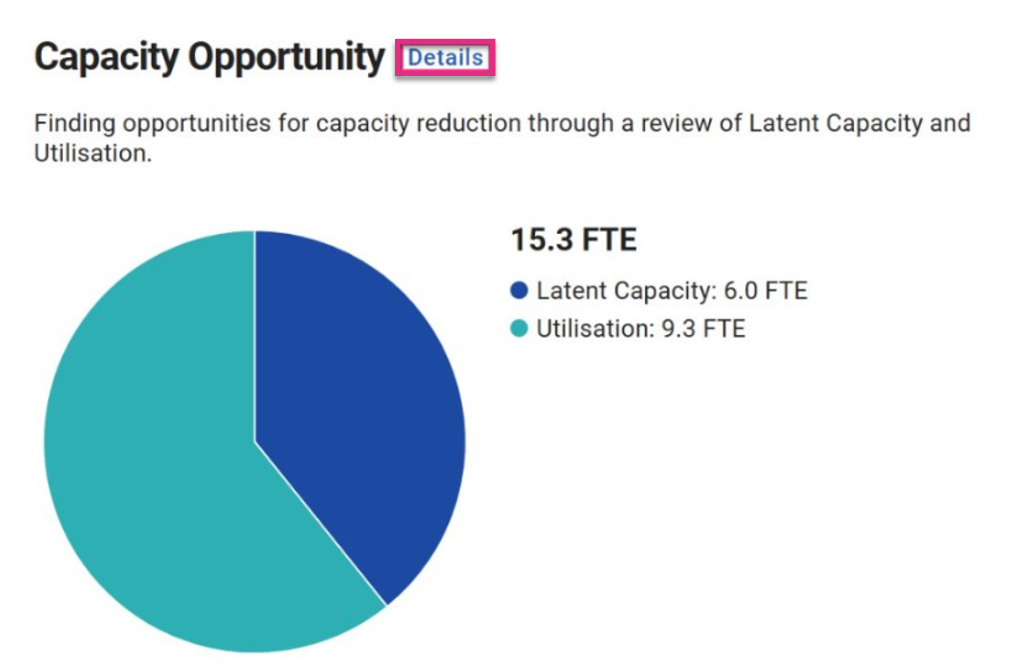
The panel includes a pie chart that illustrates the split of total opportunity between opportunity available through reducing Latent Capacity and that available through increasing Utilisation.
Clicking on the Details button will expand the data further.
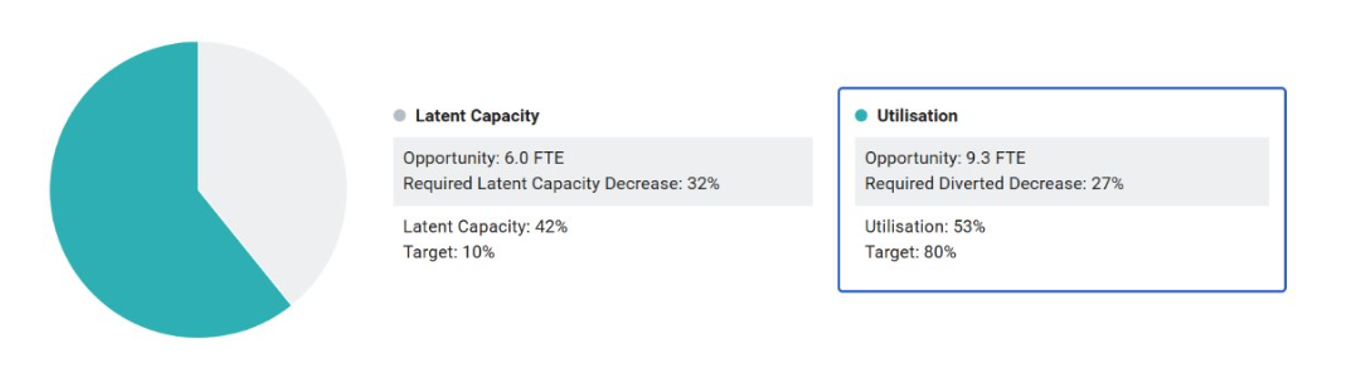
The expanded data will provide a view of the Latent Capacity and Utilisation achieved compared to target.
For each value you will see:
-
Opportunity, the FTE of capacity that could be acquired if the target was being achieved.
-
Required decrease, the reduction in either Latent Capacity or Diverted time required to meet the target.
-
Achieved Score, the actual Latent Capacity or Utilisation percentage achieved during the period being reviewed.
-
Target, The target Latent Capacity and Utilisation percentages. This is based on the targets set during configuration of the Fly by Five Dashboard.
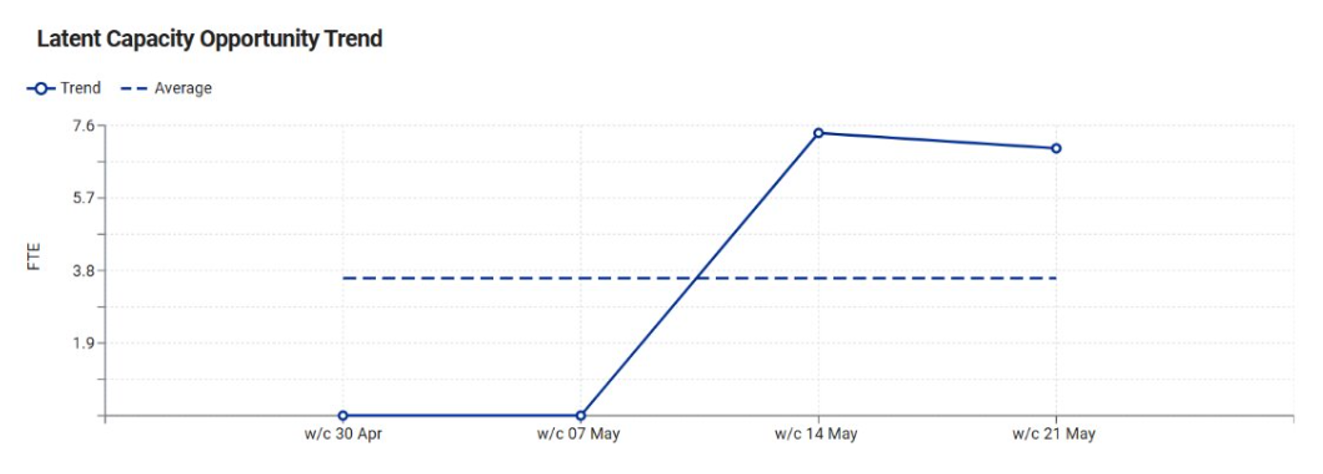
The expanded data also provides a view of the opportunity values on a weekly basis to help identify any trends. The chart will display the data for the metric selected in the section above detailing performance against target.
Holding your cursor over a data point will prompt a pop-up box to appear that details the date, average opportunity for the reporting period and the trend for that week in FTE.
The last chart in this panel breaks the overall opportunity down by child workgroup. The chart will display the data for the metric selected in the section detailing performance against target.
The chart will display the 5 workgroups that have the largest FTE opportunity. Those workgroups that don't fall withing the top 5 can be viewed by clicking on the > icon next to the ‘Other’ header.
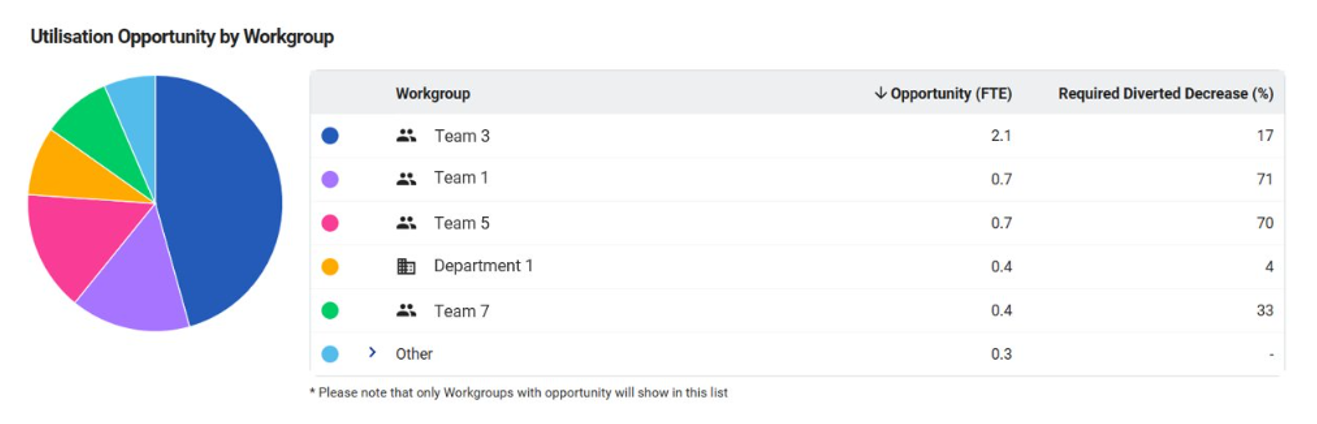
By default, Utilisation/Latent Capacity Opportunity will sort the workgroups in descending Opportunity (FTE) order. You can resort this data by ascending order by clicking on the ![]() icon next to the Opportunity (FTE) header.
icon next to the Opportunity (FTE) header.
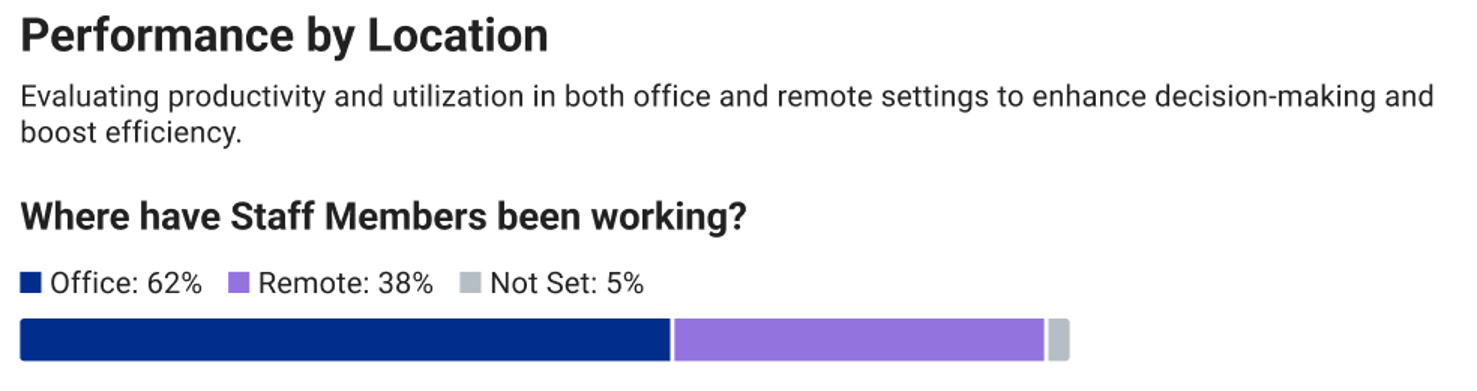
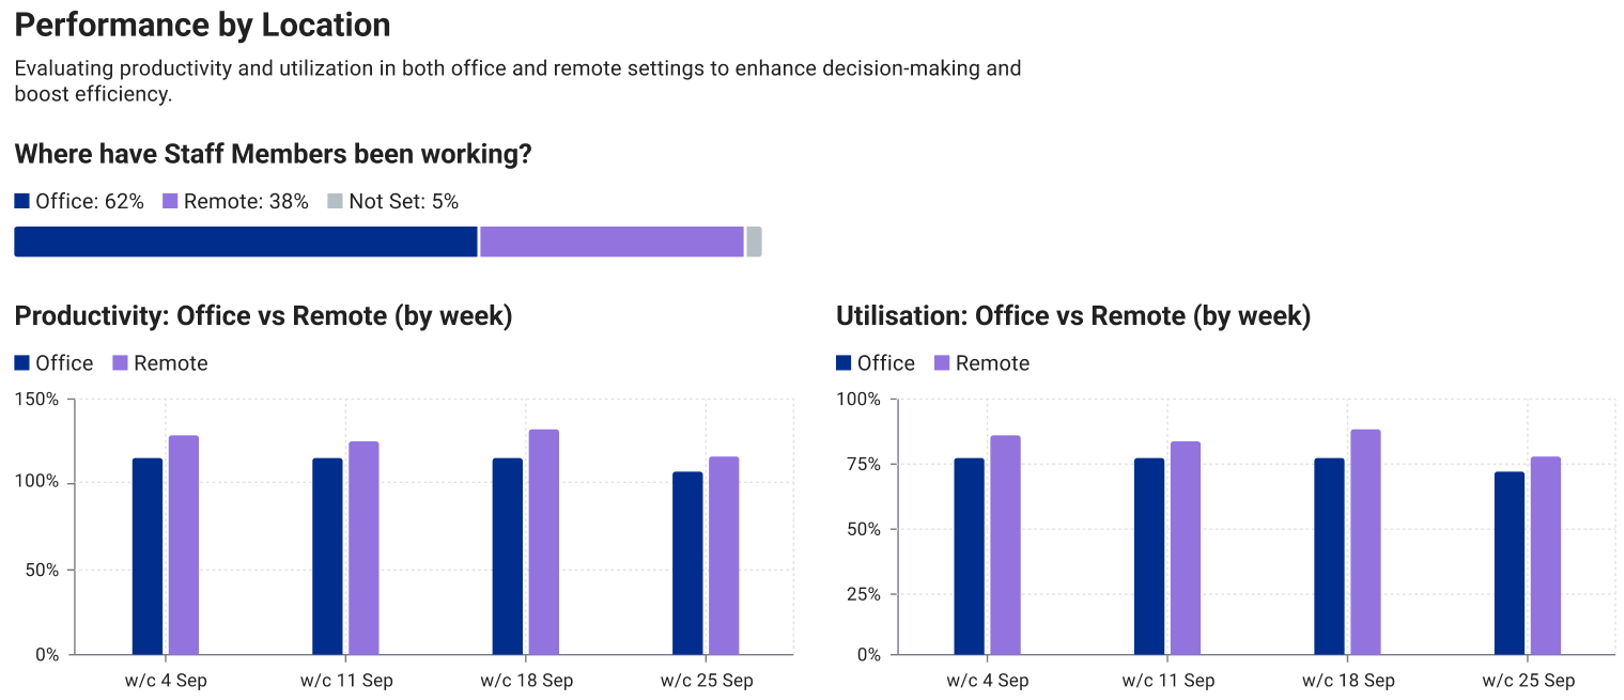
The Performance by Location panel compares productivity and utilisation when employees are working from different locations, such as 'in office' versus 'home'. This comparison can reveal if location impacts work efficiency.
The panel details the percentage of total time worked logged to each of the work location options.
The graphs provide a view of the productivity and utilisation achieved during the captured hours for Office and Remote working.
The Benchmark Insights panel provides a view of 4 key metrics for the selected workgroup and how they compare to the broader ActiveOps community.
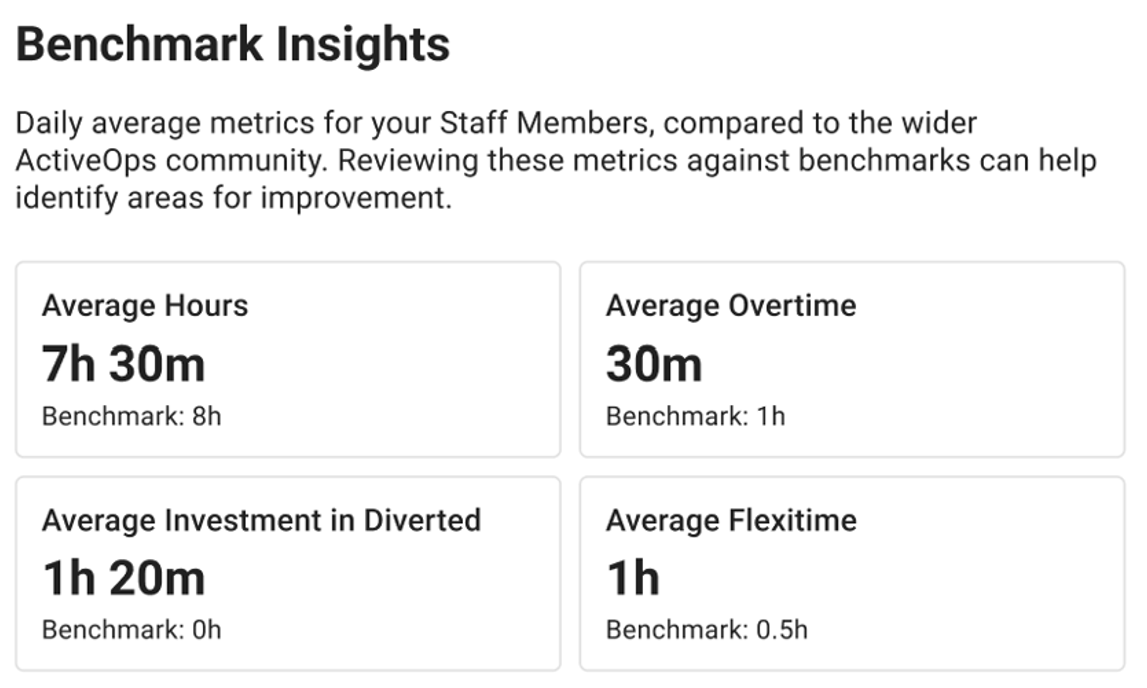
The selected workgroups values are based on average per staff member per day across the selected reporting period, either 30 or 90 days.
The Benchmark value is based on the average per staff member per day across all ActiveOps customers over the past 3 years.
When viewing the dashboard, amending the reporting period will prompt the selected workgroup values to update to reflect the average over the selected period but the benchmark values will remain the same as they are calculated across a 3-year period.
The My area panel provides a quick snapshot of the selected workgroup, its size, average span of control and insight into loaning and borrowing.
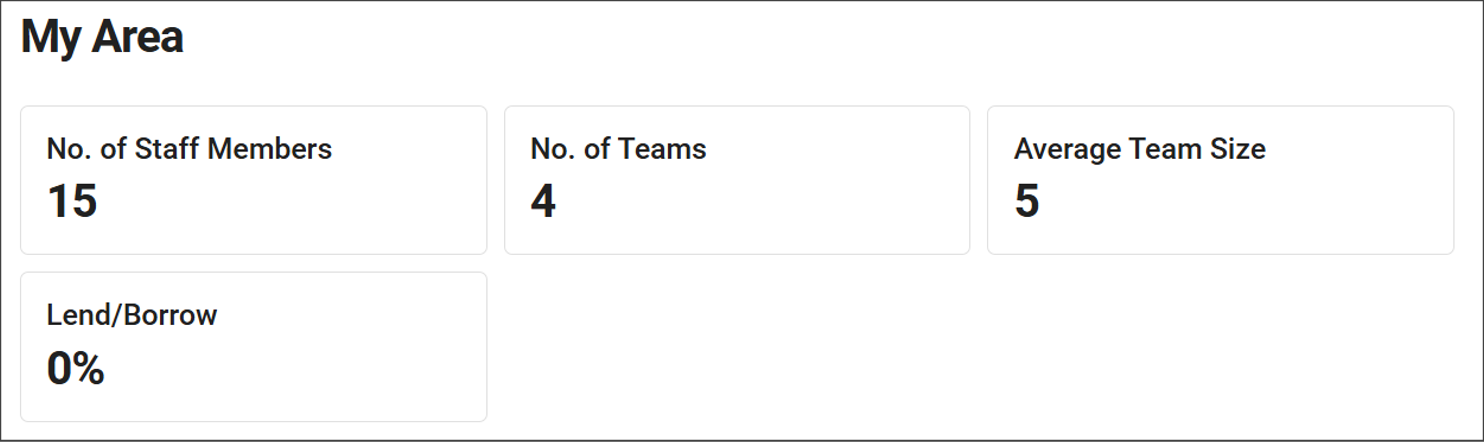
-
Number of staff members – The number of staff members linked to the teams within the workgroup.
-
No of teams - The number of teams linked to the workgroup.
-
Average team size - The average number of team members linked to teams within the selected workgroup.
-
Lend / borrow - The amount of time spent lent or borrowed as a percentage of the time worked.
The average Team Size and Lend/borrow tiles also provide Benchmark insight. The selected workgroups value is based on the average over the reporting period selected and the Benchmark value is based on the average across the wider Activeops community over the past 3 years of data.
| Series 4.0 links | Video |
|---|---|
| Smart Skills Centre | Smart Skills Video |
| Business Planning | Business Planning Video |
| Executive Insights | Executive Insights Video |
| Opi | Opi Intro Video |


